Jure Leskovec, professor of computer science at Stanford, is interested in what sorts of novel questions we can ask about media now that (much of our) news is on the web. His work on tracking memes by tracking short phrases led to MemeTracker.org, a tool celebrated for allowing a new way of examining media through watching how quotes spread through professional and citizen media. His talk at Berkman today starts with his Meme Tracker work and expands to two exciting computer science questions:
– Can we infer network structure based on examining who mentions certain pieces of information?
– Can we identify the most powerful influencers in networks, the sites most responsible for breaking news?
Jure tells us that he’s interested in the intersection of news media, technology and the political process. Specifically, he’s fascinated by the tension between global effects of mass media and local effects carried by social structure. “How does information transmitted by the media interact with the personal influence networks that arise from people’s social networks?”
These relationships are changing in an era of participatory media. “The dichotomy between global and local influence in evaporating – blogs can have influence both in personal and global media networks.” At the same time, the speed of media reporting and discussion is getting much faster. We sometimes refer to this as the 24-hour news cycle – basically, we’re starting to see a rapid progression of stories with no pauses.
Is there still a “news cycle”, where stories break at regular daily intervals? Jure’s work on Meme Tracker started by asking “What are the basic units of the news cycle?” We might look at the emergence of stories by looking for “cascading hyperlinks to articles” – based on doing some research in this field, Jure feels like this is too “fine-grained”, and suffers from the problem that news media don’t link very often. He rejected as too “coarse-grained” either looking for named entities (Obama is mentioned in the news every day – he’s not a very useful story marker) and defining topics as “probabilistic term mixtures”. Looking for common sequences of words – the appearance and decay of phrases – as too noisy.
To find markers of stories that could correspond to aggregates of articles, that vary over the order of days and can be handled at terabyte scale, Jure looked for quoted phrases. Quotes are an integral part of journalistic practice, and they tend to follow iterations of the story as it evolves. They’re attributed to individuals with a specific time and location, which means they’re very useful in figuring out the starting point for a specific story.
Using data from Spinn3r collected for three months leading up to the 2008 US presidential elections, Jure collected 1 million news articles and blog posts from the 20,000 sites that are part of Google News and 1.6 million blogs that are not. The system picked up roughly 100 million documents, from which he extracted 112 million quoted phrases. (As Jure’s slide puts it, he was looking for “.*”)
Once the system identifies quoted phrases, it’s challenging to figure out whether one quote is a degenerate version of another. Phrases change and mutate quite a bit. Jure shows a slide of Sarah Palin’s quote, “Our opponent though, is someone who sees America it seems as being so imperfect that he’s palling around with terrorists who would target their own country?” and dozens of partial version he found in the wild. Jure’s algorithms create a directed graph of subphrases, adding directional edges that lead from shorter quotes to longer ones, and then weigh and remove edges so that each node has a unique parent. This simplification gives single parentage to phrases, and can partition a graph into different subgraphs for different parent phrases. (Spam, he tells us in response to question, is not a major concern. He did, however, have to stoplist movie and CD titles, which often appeared as quoted phrases.)
A graph of the appearance of new quotes gives the opportunity to consider whether there’s a periodic structure to media. The phrase per hour count oscilates on a weekly basis – there’s less news on the weekend – but there’s no particular global data he’s been able to find. Quote flow is more or less constant.

A widely published image from his study – shown above – is a graph of the fifty largest clusters (in volume terms) over the three months of the study. Some of the phrases – Obama’s statement that “You can’t put lipstick on a pig” – have a huge volume in comparison to the average topic size. Based on typical clusters, Jure is looking for models to represent the shape of story attention. “The peak behaves like a delta fundtion with infinity at t=0,” which is to say, phrases are really short lived and exponential functions aren’t fast enough to model the peak.
Jure tags media sources as being either “news” or “blogs” depending on whether or not they’re reproduced by GOogle News. “News” – i.e., sites in the 20,000 reproduced by Google News – account for 44% of the stories. Based on this partition, Jure compares the peak in attention between news sites and blogs. “Peak blog intensity comes about 2.5 hours after news peak.” There are blogs that are exceptions to this rule – hotair.com, talkingpointsmemo.com, politicalticker.blogs.cnn.com, huffingtonpost.com, digg.com are well ahead of others. These blogs are run by professional bloggers, people who have resources to follow and report stories. He posits a model – professional bloggers sometimes break stories, followed by mainstream media, then followed a couple hours later by casual bloggers. How often do bloggers lead the media? He looked for a signature that this was happening – stories that appeared in the blogosphere before it did in news media – and discovered that, in total, 3.5% of phrases migrated from blogs to media.
While the meme data is useful for understanding some of the dynamics of the relationship between blogs and mainstream media, there are massive open questions about how information really spreads. Jure suggests thinking of the mediasphere as a massive hidden diffusion network. We can see when a node in this network gets “infected” with a new story, but we don’t see the edges between nodes in this graph. Could we trace the actual propogation from one source to another?
Basically, this becomes a tough graph theory problem. We can study a “cascade” of a story by watching how a quote appears over time. We can then make guesses as to whether one source infected another by building probability trees. If timestamps are closely linked – i.e., source i posts a story at 3:44 and source j at 4:12 – the probability is higher that i infected j than if the time gap is a long one. Jure tells us that we need to consider a huge set of possible graphs, each representing the probability of a particular path of infection (idea spread). This problem is difficult to solve, but the matrix tree theorem can poduce a solution in cubic time (O(n^3)). Jure tells us his implementation can find a near-optimal solution. This looks like a map of the mediasphere clustered around topical interest – a strong cluster around US politics, one around gossip and celebrity news, and another strong technology cluster.
If we can infer structure, can we decide what to read if we want to be most up to date? We could imagine one blog that covers lots of topics, but is usually late to the party. Another might have lots of breaking news, but not be especially comprehensive. Given a budget – I only want to read five blogs, for instance – how do we choose which five I should follow to maximize comprehensiveness and timeliness. Again, this is a hard problem, specifically an NP-complete problem. But there’s an algorithm to find an approximate solution, and it’s far better than just choosing blogs at random, or selecting them by their inlinks, outlinks or volume.
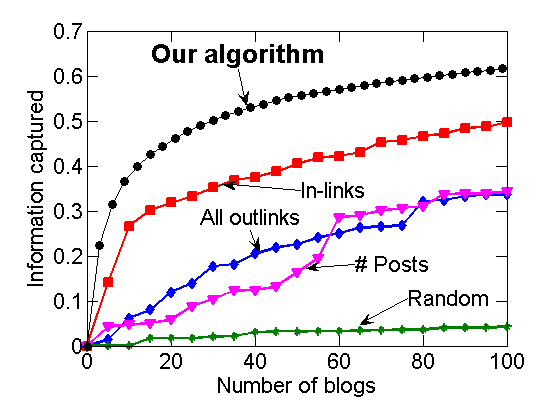
From blogcascades.org, which offers information on the algorithm
The goal behind experiments like this one isn’t to assign us blog attention budgets – it’s to build a framework for tracking memes and news as they track over the web. (Regular readers will know that this is an obsession of mine, and the idea behind MediaCloud, which helps explain why I was so excited Jure was coming to Berkman.) There are still lots of open questions which leave Jure with more work to do:
– Which elements of the news cycle are missed by analyzing quotes, rather than other structures?
– How do we identify and analyze polarization in populations who are propogating information?
– How do memes actually spread through groups of people?
Lots of questions from the Berkman crowd:
Q: Could you make the system work running with sentences?
A: Possibly, but there’s lots of noise in the system, and things get noisier the longer time periods we try to consider. We’re currently trying to make it work with tweets, which are short and cleanly timestamped.
Q: Did you come up with a rigorous definition or description of the news cycle?
A: We found some signatures for clusters. One common pattern is a meme that starts small on day one, is sharply amplified on day two, then decays. Another reverses days one and two. And a third just spikes quickly and decays over a long time.
Memetracker is now working with Pew’s Project for Excellence in Journalism, looking at coverage of the economic crisis, and that’s helping study of how media cycles operate.
Q: Are aggregators comprehensive in providing coverage of the mediasphere? Could we just read Google News?
A: Probably not. Our algorithm looks for news sources with little overlap – Google News has lots of overlapping news sources.
Q: So, what was the solution to reading three blogs? What three should we read?
A: Well, based on the data from 2006 – Instapundit, donsurber.blogspot.com, Science and Politics (now dead, with a note poking fun at Jure’s research), Watcher of Weasels
Q: Will influentials in networks continue to have influence over time?
A: Algorithms select influencers based on past behavior. If you choose naively, it won’t work well. We might need to limit these sorts of algorithms only to larger blogs.
Q: You’re inferring an infection tree by optimizing a graph. Is there any empirical data to test whether this is what really happens?
A: We can check by using data sets where we’ve got quotes and links. If we can reconstruct the link structure just based on quotes – which we can – that’s probably a pretty good empirical test of the algorithm.
Great summary, Ethan. Helped me get to about 90% understanding from about 75% when I left the lunch talk (can’t wait to take stats next year!). My takeaway (such as it was with 3/4 understanding of the project) was that we still don’t/can’t know where we should focus our attention if we want a good media diet, but also don’t have hours and hours to absorb information from a diverse set of sources. Is it possible for us ever to get to a point with these tools that one could query in real time the best place to get news about x breaking news topic or policy issue? And what about the qualitative part of all this? Those top 10 returns from Jure’s 2006 study weren’t exactly what one would consider venerable news sources–how can we judge for reliability (Drudge and TMZ might be fast, but I’m not sure I want them as part of my diet)? Anyway, lots to think about–thanks for writing it up!
Do you have a link to a larger version of that first image? It’d be more meaningful if the text were readable…
Cos, all the slides are online here: http://cyber.law.harvard.edu/sites/cyber.law.harvard.edu/files/memetracker-harvard-feb10.pdf
Pingback: Tools for verifying and assessing the validity of social media and user-generated content
Comments are closed.