What’s a “holy shit visualization”?
It’s a way of looking at data that makes turns a statistic you might have flipped past in a book or skimmed by on a web page into something that you can’t forget. It’s a visceral reminder of the power of images and the power of looking at dry numbers in human terms.
For Mike Evans, the map below was a holy shit visualization. Properties in yellow are in tax distress. Those in orange are under tax foreclosure. Those in red have been foreclosed.
In 2014, 50% of properties in the city of Detroit were in danger of foreclosure, being foreclosed, or owned by the city. That’s a frightening statistic. But seeing what it looks like on the map makes the scale of the problem more visceral.

Evans knew this was a powerful visualization when he took the map to the county treasurer, who had his own “holy shit” moment seeing the data. Mike asks, “What does it mean when the county treasurer doesn’t know this? What does this mean for a homeowner who’s far more removed from this information?”

Mike Evans, image from Crain’s Detroit Business
Evans is senior developer with Loveland Technologies, a for-profit technology consultancy in Detroit, MI that focuses on mapping land ownership in cities, especially in Detroit. He visited Center for Civic Media at the MIT Media Lab yesterday to talk about the community mapping work he and his team have taken on in Detroit and around the US. Loveland is a project started by Jerry Paffendorf, who had the clever idea of selling distressed properties in Detroit one square inch at a time. Detroit auctions thousands of properties at a time, and properties that don’t sell for outstanding taxes begin auctioning for $500 apiece. Paffendorf bought some of these properties and started selling them off via Kickstarter for a dollar per square inch (one of the first Kickstarters ever started), and Loveland Technologies got its start building a map that let people see their property ownership, much as the Million Dollar Homepage allowed advertisers to see their online presence purchased a pixel at a time.

Merry Inchmas from Inchy, Loveland’s first mascot.
(There was a serious side to the idea. Paffendorf felt like most people don’t get the chance to be property owners, and speculated that owning even a tiny piece of Detroit would get people thinking more seriously about the problems and challenges the city faces.)
The map, designed to visualize a fanciful public art project, began growing more complex features. But it took on a life of its own when Evans layered data from the county’s massive foreclosure action onto the map. Suddenly, the Loveland map became a resource for Detroit homeowners to tell whether their neighbors were in trouble, whether their neighborhood was in danger of attracting blighted properties, whether they might lose their homes.
“We put this out and suddenly people are calling us up, complaining that we’re illegally foreclosing on their property, demanding that we take them off the list,” Evans remembers. “We’d explain that we weren’t the authorities – we were just visualizing data. And people, not unreasonably, would say ‘You wouldn’t be doing this if you weren’t the city.'”
“It’s a powerful experience,” he explains. “You look up your childhood home and you either breathe a sigh of relief or you call your mom. You click on your neighbors and your friends, and when you get bad news, you start thinking about how you might help them.” The tool quickly became popular with churches, who would look up houses of congregants, and then raise money to rescue members who were in distress. Often churches and friends wouldn’t raise enough money to pay off people’s debt, but payments as small as $300 could often forestall foreclosure for as much as three years.
The name Evans and colleagues gave the tool – Why Don’t We Own This – has at least two meanings. Why are Detroiters being removed from their homes when no one else wants to buy these properties? And how can Detroit take ownership and responsibility for the problems facing the community?
As the map gained prominence, “We became ‘the guy who can get you things'” Evans explains. City council members began asking for reports on their districts so they knew what areas were most affected. With high-level requests for data coming in, Evans and colleagues had more leverage to ask for data. While they’d scraped the initial set of auctions data despite city objections, people within city government started volunteering data sets to the project, and the tool became more feature-rich.
In portraying the city’s foreclosure crisis, Evans offers sympathies for both homeowners and for the city. Many of these forecloses houses were left in wills by grandparents to grandchildren, he explains. The people who inherited properties didn’t know about the water bills and property taxes they would need to pay, and quickly found themselves falling behind. At the same time, it’s hard to put too much blame on the city, which is coping with municipal bankruptcy, accusations from the UN that Detroit’s water shutoffs violate human rights, and a fire department so broke that it uses a fax machines and Faygo cans filled with change as a fire alarms.
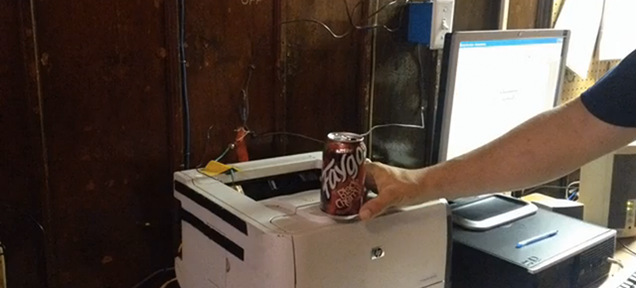
Detroit fire alarm. Really. Photo from Detroit Free Press.
Every mayor who’s taken leadership of the city agrees that a critical step towards improving the city is confronting the problem of urban blight. (Evans refers to these as “OMGWTFBBQ” properties.) Abandoned houses attract illegal dumping. They lower the property values of other houses on the street. Kids are afraid to walk to school past the buildings, not knowing who or what is in them. There’s widespread perception that every mayor has failed to address blight… but Evans points out that the city has torn down more than 25,000 buildings between 1995 and 2014. “Cities don’t get the love even when they do what they said they would do,” Evans offers. “But actually, it’s government’s job to make sure we know what they’re doing regarding blight.”
Addressing blight is a major motivation for offering open data in Detroit. Detroit has an open data portal, but it’s not exactly a marvel of usability – to really use the data, in many cases, you need to export the data to a GIS program like ESRI. Evans offers a real-world example of the importance of accessibility: a homeowner who wants to attack blight in her neighborhood by mowing the lawns of unoccupied houses on her street needs a simple way to know whether properties are occupied or not. “Accessibility is the real open data. Just having it open isn’t important if people can’t utilize it.”
The idea of accessible, usable data that Detroiters could leverage to protect their neighborhoods helped inform the project Loveland Technologies is most famous for: Motor City Mapping. Based on the success of their map of foreclosed properties, the Loveland team was invited to a meeting involving Dan Gilbert (local billionaire, founder of Quicken Loans), the White House, the Kresge and Skillman Foundations, and local projects like U-Snap-Bac, which provides funding to restore distressed properties. The team started with the idea of removing every blighted building from the city, and quickly realized that they would need a comprehensive map of Detroit’s blighted properties. The Loveland Technology team made the argument that they should instead map every property in the city, take photos and try to determine whether those properties are occupied or not.
What resulted from the discussions was Motor City Mapping, a wildly ambitious project that mapped 400,000 properties in about a month using 150 volunteers armed with Android tablets. As Evans explains it, he wanted nine months to take on the project and ended up being negotiated down to a month-long development cycle. As he was unboxing and syncing 150 new Android tablets, the data collection software he’d built was two days old and still riddled with bugs. (Evans had wanted to roll out on iOS, but the process of releasing software, waiting for Apple’s approval and reinstalling was too slow and pushed him onto Android, at a time when the tablets he wanted were just coming on the market and were hard to obtain.)
For the next month, 150 surveyors walked the streets of Detroit photographing each property, reporting its condition, identifying blight and determining whether a house was occupied. Evans and a colleague stayed in the office, fixing bugs and adding features. “It was the best kind of scope creep. We’d realize we needed Google Street View data as a double-check for locations. We’d want to add in assessor data. The tool got more complicated and more useful every day.”
Having real-time data matters when you’re trying to transform a city. In particular, it’s critically important to have data about whether properties are occupied or abandoned. Detroit’s police force is so stressed that they generally don’t evict homeowners when their properties have been foreclosed on. As a result, buying a foreclosed property at auction in Detroit is a deeply uncomfortable gamble. The property you bought for $500 might be abandoned and ready for you to fix it up… or it may be occupied by a family unhappy about you showing up on their doorstop. Most investors don’t want to purchase the occupied buildings, which is why having Motor City Mapping’s data on occupied properties is so crucial. As the project has continued from its startup phase, the team prioritizes re-surveying tax distressed properties they believe are occupied, trying to minimize situations where people are purchasing occupied buildings.
Realtime, or near realtime, mapping of a city has other positive implications. When the city wants to provide services like cutting grass, they can use the maps to scout areas ahead of time, and can mark maps once they’ve provided services.

Evans shows off the ability to generate custom maps based on queries. What properties in your neighborhood are in poor condition or recommended for demolition? The map above shows how to generate that information with a few button clicks.

It’s important, also, that maps are annotateable. The image above shows an apartment building that was in good condition when Motor City Mapping checked it out. But below, a resident has reported that the building was damaged by a suspicious fire and should now be considered a blighted structure.

Real-time mapping was challenging and expensive to accomplish. Most of the 150 workers who surveyed the city didn’t have cars, Evans explains, so Quicken Loans employees volunteered to act as their drivers. Since volunteers would be in a car all day with workers, Motor City Mapping then ran background checks on their workers, and ended up losing 30%, who had records for violent offenses or felonies. Maintaining a team of mappers long term may not be something Detroit can afford – instead, mapping may come in part from citizens who download the app and use it to maintain maps of their communities.
Loveland Tech, in the mean time, is taking on government contracts and expanding their system to include dozens of other cities. They sell the tools that allow other cities to overlay data sets on their street maps. Unfortunately, the tool is only one part of building a system like the one in Detroit. Buffalo, NY, a city that features many of the problems Detroit faces, offers a beautiful map but without information on condition or occupancy. To make the maps really useful, cities need to work with Loveland to release key data sets, a process that can trigger resistance from government agencies, some of which see selling this data as a way to address their budget shortcomings. Evans remembers that it took two months into the Motor City Mapping project before the Wayne County Assessor would give the team their data set – until they came under massive public pressure, the Assessor wanted to sell the data instead.
If the impact of Loveland’s maps makes city officials say “holy shit”, it’s worth asking how Evans and his team have been so successful in taking on these controversial, provocative and deeply useful projects. Evans credits much of the success to being in the right place at the right time, to being invited to meetings like the one that launched Motor City Mapping.
I think Evans, Paffendorf and others have a secret weapon in these battles: the power of whimsy. Before joining Loveland Technologies, Evans was the founder of PishPosh.TV, a video production company that wanted to build “a discovery channel that doesn’t suck”, showcasing maker culture and teaching people about low-cost computer hardware like Arduinos and Raspberry Pis. (It’s taken on a newsier, muckraking tone recently with Slash Detroit.) Evans heard that Paffendorf was building a free, urban minigolf course with art professor Steve Coy and decided to make a video of the project. Soon after, Evans moved his video production company in with Paffendorf’s “Imagination Station“, and became a co-conspirator on multiple projects.
Not all these projects are easy to explain. Paffendorf gained a certain amount of notoriety in Detroit by raising $67,000 to build a statue of Robocop, to be erected in downtown. Slopping reporting and online rumor-spreading led to outrage over the idea that a bankrupt city would use public funds for a fanciful sculpture – as Evans patiently explains when I bring up Robocop, all money came from donors (many from outside of Detroit), and the statue will be build from molds made by the original designers of the costume at Universal, and forged at Venus Bronzeworks, a venerable Detroit institution. But the sheer silliness of the idea has a life of its own and has led to previous Detroit mayors coming out publicly to oppose the statue project.
I think this gift for whimsy helped Evans and Paffendorf avoid some of the initial resistance they might have faced when launching projects like Why Don’t We Own This. After all, it’s hard to worry about a couple of kids upending Detroit’s foreclosure policy when they’re the guys best known for urban minigolf and fanciful Kickstarter projects.
Evans has a simpler explanation than the one I offer. When you’re broke and taking on projects out of passion, not out of profit, it’s hard for people to stand in your way. When he began scraping auction data from county websites, it was easy to ignore any potential legal consequences. “What are you going to do? Sue us? We’ve got nothing. You want to bankrupt us? Okay, here – you can have our dog.” (Fortunately, the county chose to work with them, rather than threatening legal action.) When the laughter at Center for Civic Media dies down, Evans explains, “It’s scary to those in power when people are able to do projects like this out of love, and there’s nothing you can really threaten them with.”
Pingback: Data, What is it Good For? | datatherapy
Comments are closed.